App analytics
App analytics
App analytics
Webflow is a visual development (“no code”) platform for building and managing websites.
Apart of the platform are apps designed to extend the capabilities of the platform. App developers build apps and submit them to the marketplace. Once approved anyone in the community could download and use the app.
Webflow is a visual development (“no code”) platform for building and managing websites.
Apart of the platform are apps designed to extend the capabilities of the platform. App developers build apps and submit them to the marketplace. Once approved anyone in the community could download and use the app.
Webflow is a visual development (“no code”) platform for building and managing websites.
Apart of the platform are apps designed to extend the capabilities of the platform. App developers build apps and submit them to the marketplace. Once approved anyone in the community could download and use the app.
Duration
Duration
5 months
5 months
5 months
Role
Role
Lead product designer
Lead product designer
Lead product designer
Team
Team
Product manager
User researcher
4 Engineers
Product manager
User researcher
4 Engineers
Scoping & Ideation
Scoping & Ideation
Scoping & Ideation
Apps were launched to the Marketplace in 2022. Since then, Webflow has continued to invest in ways to support app developers as they create, test, and mange their apps. The team conducted user research to find out how to improve the experience.
Apps were launched to the Marketplace in 2022. Since then, Webflow has continued to invest in ways to support app developers as they create, test, and mange their apps. The team conducted user research to find out how to improve the experience.
Apps were launched to the Marketplace in 2022. Since then, Webflow has continued to invest in ways to support app developers as they create, test, and mange their apps. The team conducted user research to find out how to improve the experience.

User research
User research
User research
Webflow uses a standard survey structure metric (UMUX score) for all features to track how they are performing. This metric measures if the feature is meeting the needs of users and ease of use.
We found that developer were finding it difficult to manage an app after it's been created and submitted to the marketplace.
Webflow uses a standard survey structure metric (UMUX score) for all features to track how they are performing. This metric measures if the feature is meeting the needs of users and ease of use.
We found that developer were finding it difficult to manage an app after it's been created and submitted to the marketplace.
Webflow uses a standard survey structure metric (UMUX score) for all features to track how they are performing. This metric measures if the feature is meeting the needs of users and ease of use.
We found that developer were finding it difficult to manage an app after it's been created and submitted to the marketplace.
Creating an app
78%
78%
78%
Managing an app
56%
56%
56%
After the survey, the User researcher scheduled interviews with developers to better understand why managing an app was difficult and what was the most important problem to solve. The main pain-point we found was developers not being able to see how their app was performing in the Marketplace after it was live.
After the survey, the User researcher scheduled interviews with developers to better understand why managing an app was difficult and what was the most important problem to solve. The main pain-point we found was developers not being able to see how their app was performing in the Marketplace after it was live.
After the survey, the User researcher scheduled interviews with developers to better understand why managing an app was difficult and what was the most important problem to solve. The main pain-point we found was developers not being able to see how their app was performing in the Marketplace after it was live.

Beta testing
Beta testing
Beta testing
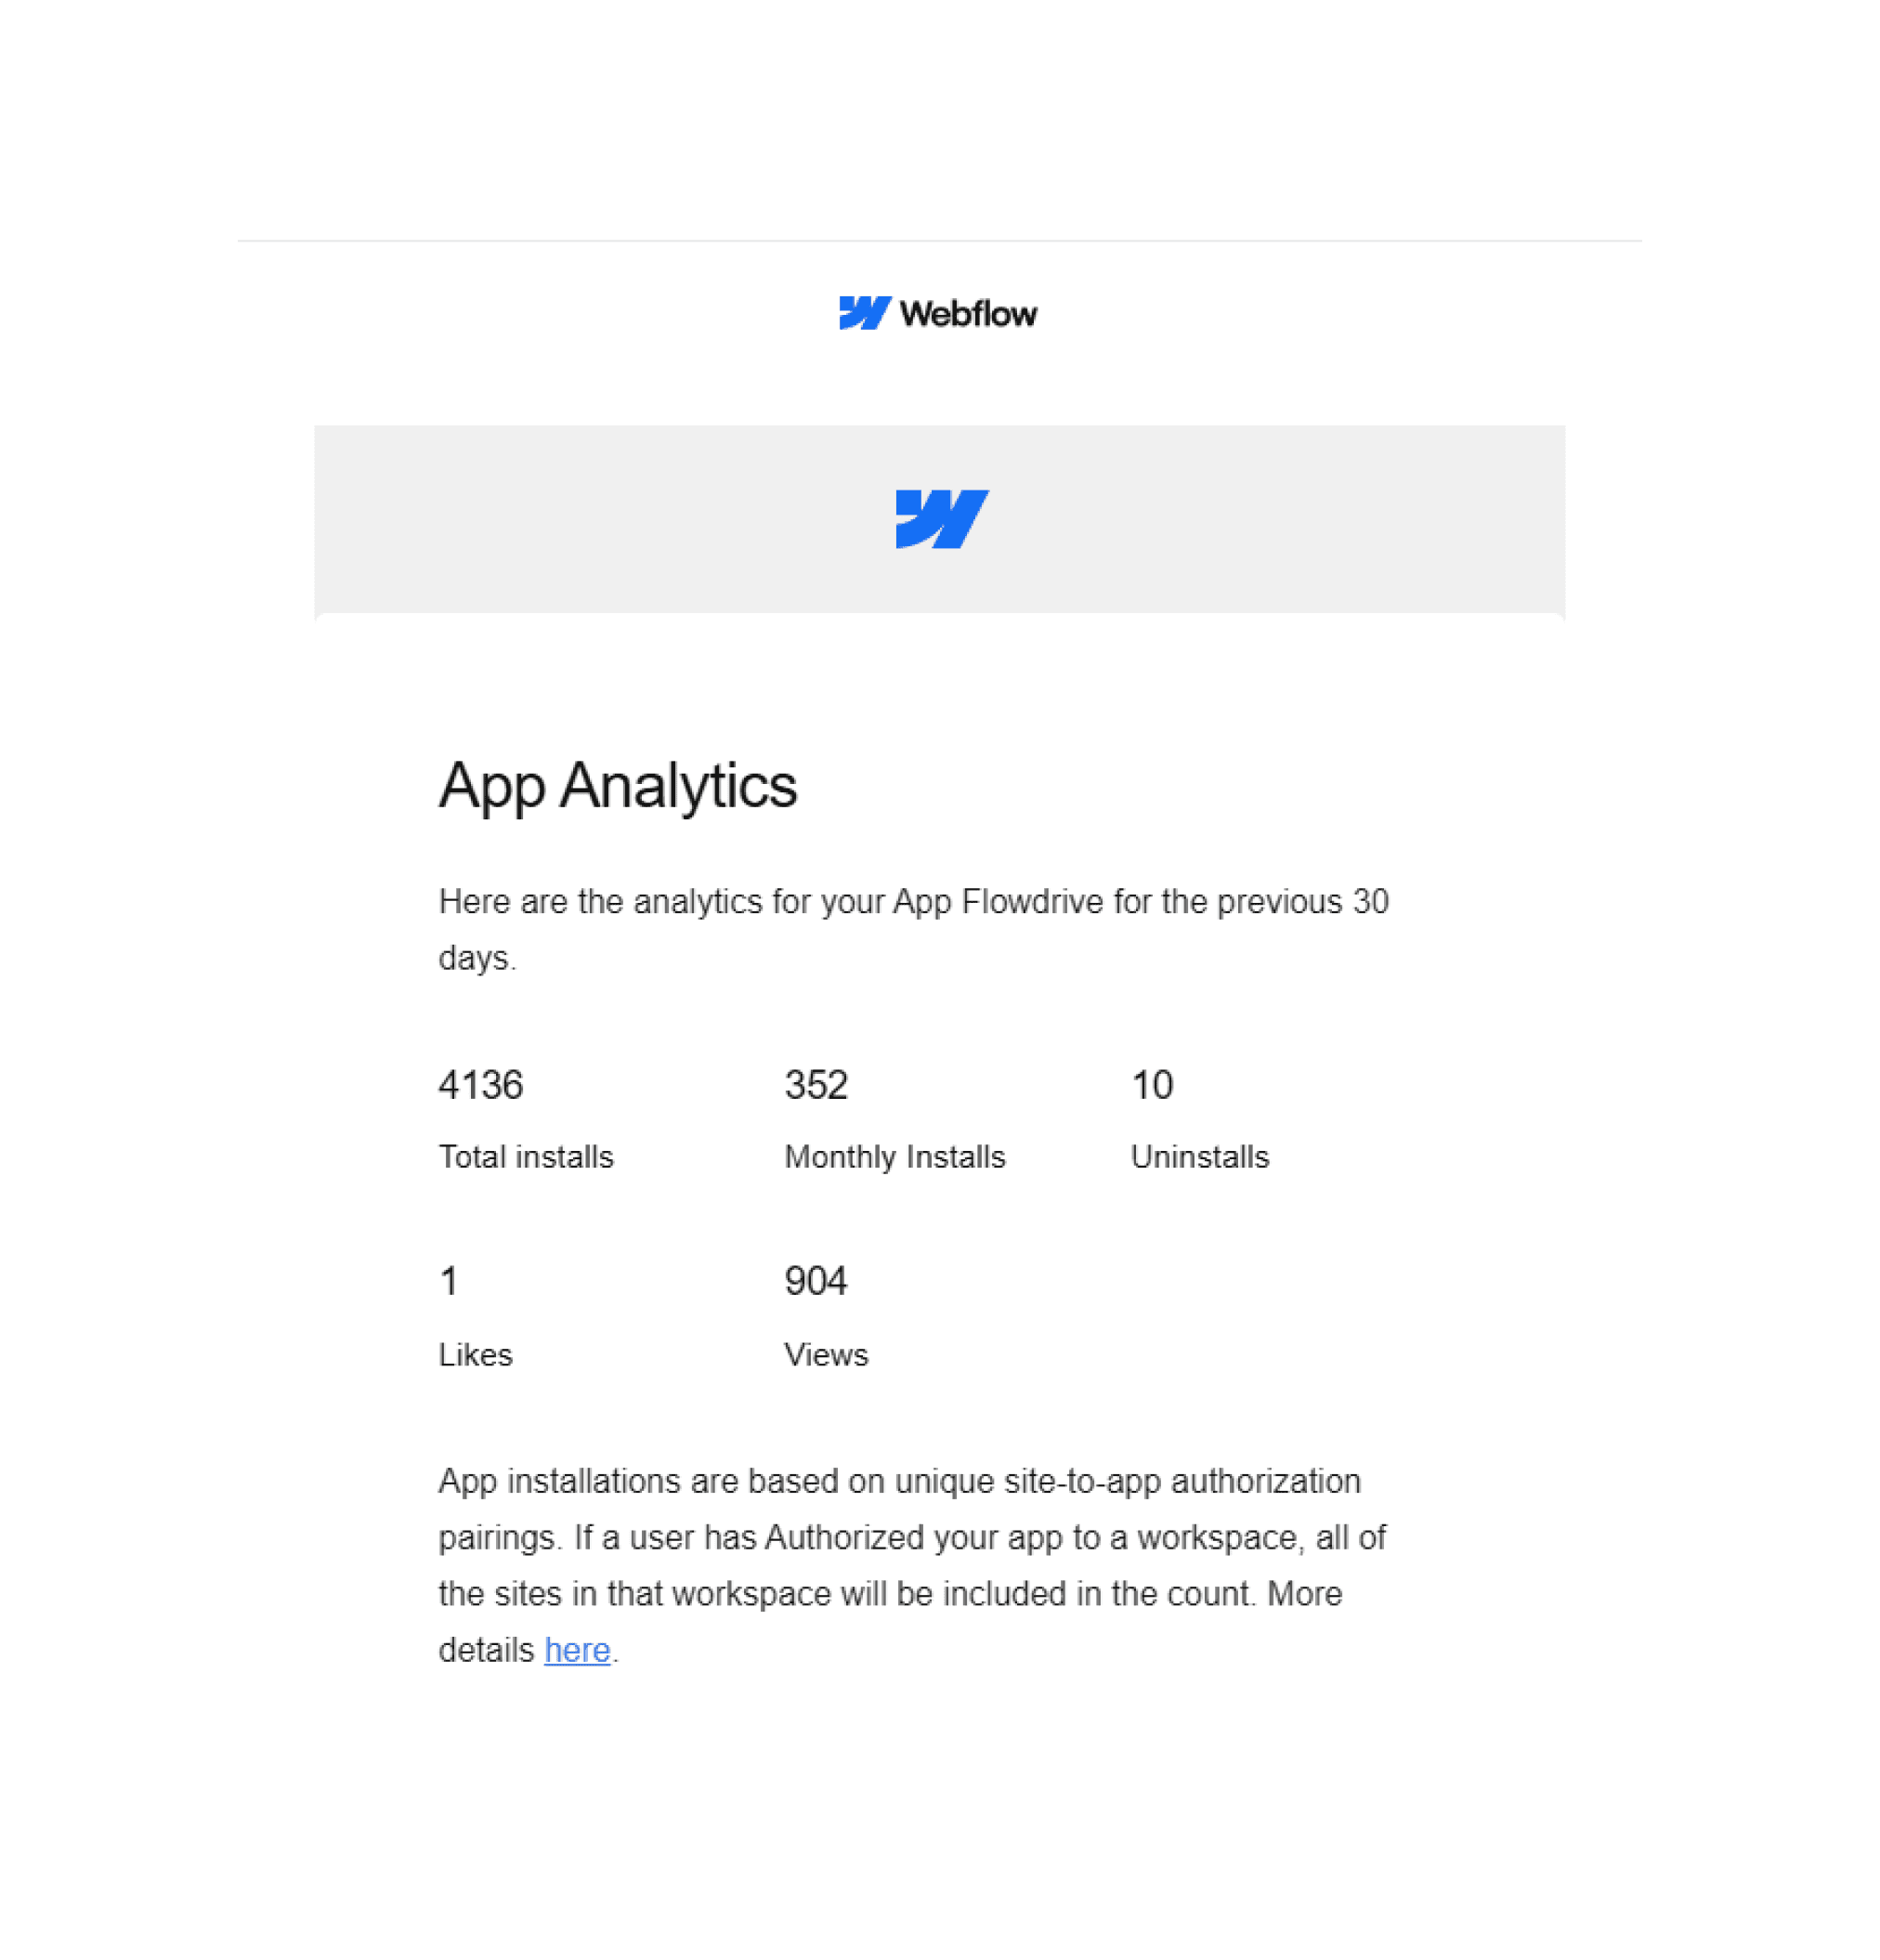
With these problem identified, the team went on to deliver an MVP solution that allowed users to see how their apps were performing - App performance email. Developers would receive an email every 30 days with metrics around app performance. This email would include: Installs (Total and monthly), Uninstalls, Likes*, and Views*.
*Found on their marketplace listing page
With these problem identified, the team went on to deliver an MVP solution that allowed users to see how their apps were performing - App performance email. Developers would receive an email every 30 days with metrics around app performance. This email would include: Installs (Total and monthly), Uninstalls, Likes*, and Views*.
*Found on their marketplace listing page
With these problem identified, the team went on to deliver an MVP solution that allowed users to see how their apps were performing - App performance email. Developers would receive an email every 30 days with metrics around app performance. This email would include: Installs (Total and monthly), Uninstalls, Likes*, and Views*.
*Found on their marketplace listing page
Ideation
Ideation
Ideation
After receiving feedback during the beta for the App email we found that this information was a useful, but with it being every 30 days it wasn't frequent enough to be actionable so the team worked on ideas for a dedicated dashboard for app developers to track all these metrics in real time.
After receiving feedback during the beta for the App email we found that this information was a useful, but with it being every 30 days it wasn't frequent enough to be actionable so the team worked on ideas for a dedicated dashboard for app developers to track all these metrics in real time.
After receiving feedback during the beta for the App email we found that this information was a useful, but with it being every 30 days it wasn't frequent enough to be actionable so the team worked on ideas for a dedicated dashboard for app developers to track all these metrics in real time.

Solution
Solution
Solution
Apart of designing the solution was reviewing other examples of data visualization in Webflow like Site data usage and Site traffic analytics. I'll partnered with the Design system team to introduce new components to our system. After several iterations we landed on this 4x4 grid that would allow app developers to review all metrics across the same time period along with any percentage changes over time.
Apart of designing the solution was reviewing other examples of data visualization in Webflow like Site data usage and Site traffic analytics. I'll partnered with the Design system team to introduce new components to our system. After several iterations we landed on this 4x4 grid that would allow app developers to review all metrics across the same time period along with any percentage changes over time.
Apart of designing the solution was reviewing other examples of data visualization in Webflow like Site data usage and Site traffic analytics. I'll partnered with the Design system team to introduce new components to our system. After several iterations we landed on this 4x4 grid that would allow app developers to review all metrics across the same time period along with any percentage changes over time.